Anyways off we go!
SCRIBE POST NUMBER 1
UNIT: FUNCTIONS AND GRAPHS (again?)
After our initial half hour time wasting but still enriching talk, we got into the math portion of the period, which happened to begin with a task,(a task I remember from last year, when I was in calculus a whole 40s precal credit too early, thanks to the magic of computer generated schedules. Thats another story however.)
This task went exactly along the lines of, "Talk to your classmates. Make a list of everything you know about a function; from the definition to specific features or characteristics they may have." Now if you dont believe me that thats what our task was, you can check the slides for yourself, the info would be on the one with the graphical heart.
Now, my original plan was to type out everything Mr.K was saying after we had gone up and written our ideas, but he was talking to fast and I couldn't copy it down. So instead, I'll copy what I have, and I'll pull up a couple definitions for everyone mmkay? K sounds good :]
So, away we go with functions and everything relating!
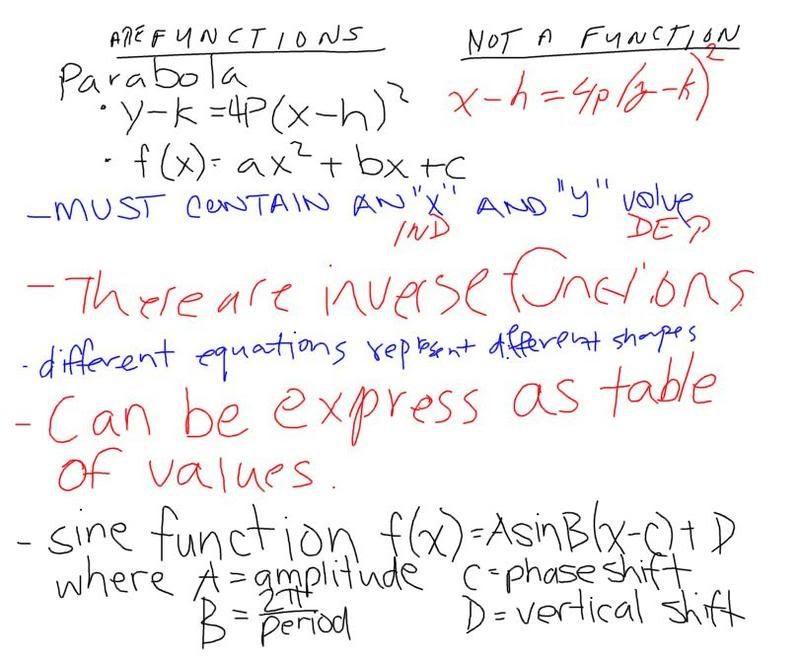
- Quadratic functions
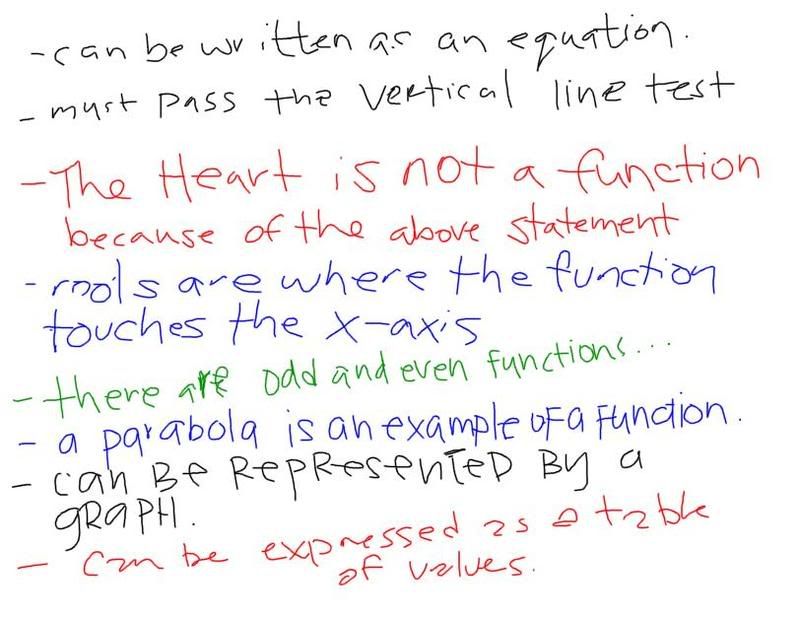
- Functions pass the vertical line test. This is because functions may be, "Many to 1" or, "1 to 1", but not "1 to many" or "many to many"
- Functions may be expressed as a table of values (I believe Mr.K said this was the numerical representation
- A vertical parabola is an example of a function
- Functions have a domain and a range where, the domain is, "All permissible independent values (inputs) of the function" and the range is, "All permissible dependent values (outputs) of the function."
- Sine, Cosine, and Tangent are examples of functions
- Functions may be expressed as an equation (I believe this was symbolically according to Mr.K)
- The Roots of a function are where the function meets the x-axis
- There are odd and even functions
- A parabola may be represented as, y-k = 4p(x-h)2 if it is vertical and as x-h = 4p(y-k)2 if it is horizontal
- Functions may have Horizontal and/or vertical asymptotes
- Only 1 to 1 functions are invertible
- Logarithmic functions are another kind of...function.
- f(x) = AsinB(x-C)+D where A is the amplitude, B/2P is the period, C is the phase shift, and D is vertical shift.
http://en.wikipedia.org/wiki/Function_(mathematics)
All posts from our old blog with the keyword "functions"
What was written by other people (some of which is here as I copied them into my own notes while we went along.) may be found on slides 2,3 and 4. I will post the slides directly into this scribe post later, as I'm typing it on a macbook, and its being a bit wonky and giving me issues with right click and things. I'll fix it up once my mom gets here with the pc -_-; Anyways moving onward. *Edit* Okay! Pictures! Heres the slides I was talking about in the earlier paragraph :]


After the collaboration of minds to create our almost exhaustive lists of things characteristic (or not) of a function, we began to get into a review of describing functions.
As seen on the slides (again I will post this image shortly, I apologize for any inconvenience this may cause you ._.;)
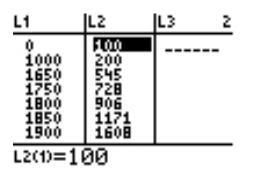
This review started with the table of values seen on the slide (Number 6 that is), and the questions beside it. It was at this point that Mr.K revealed one of his goals here, to get us using our calculators so well we cold , "make them sing."
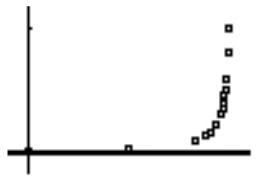
In the interest of making your calculator sing, he told us how to graph that table of values shown on the slide.
The first step to doing this is to hit the, "stat" button on your calculator, followed immediately by hitting enter. This should bring you to a screen which allows you to input values into a table.

Column "L1" is for your independent variables, while "L2" is for your dependent variables. After you've input the values, hit 2nd y=, and then enter again, and then zoom stat (or the number 9 followed by enter to select). If you've done all this correctly you should have a graph, based on the values you've input! Whewhew!

So lets re-cap, the steps are,
Stat-> Enter -> Then, input all the values from the table.
part 2
2nd y= -> Enter -> Zoom Stat (9).
Voila! You now have graph!
Okay, I think thats everything that happened this morning in class, so I'm going to go ahead and dub scribe status on Mr. Richard, since he said it was all good. Again I'm sorry about the images being late, but they should be up shortly :)
Alrighty, Justus out! :]

No comments:
Post a Comment